We recently did a post on how to use AdWords Campaign Experiments and why they have the potential to be so powerful. In that article and in Joe Kershbaum’s post over on Search Engine Watch, one of the biggest complaints was what a hassle it is to export AdWords data and report on it from Excel. It certainly is significantly more work than it needs to be, but because I think this is such an amazing tool (it can be as valuable to a PPC campaign as Website Optimizer, in many ways) I think it’s worth walking through how you can actually get at the output of your campaign experiments so that you can act on the insights.
Defining the Problem – Why AdWords Exporting of ACE Needs Help
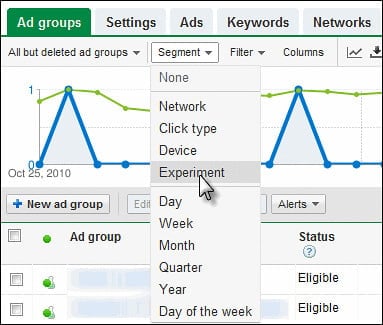
Let’s imagine we’ve set up a nice AdWords campaign experiment. How do we view this data? Well, we can start by creating a segment around our experiment:
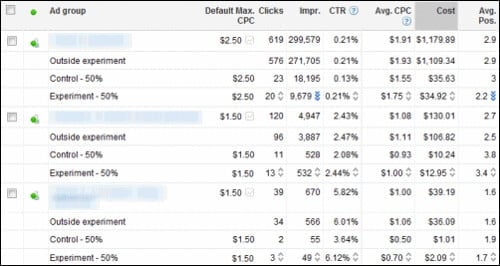
Next you can take a quick look at the results of your experiments:
As you can see there are some nice visual cues to indicate whether your campaign has reached statistical significance. This is great for one or even a few data points. But if you’re running a test across numerous keywords or ad groups or want to look at data from multiple date ranges at once this view becomes very cumbersome very quickly.
And if we try to export this data to Excel, we’ll just see a rolled up view of how a keyword is performing. Luckily, there are a few steps you can take to get this data “out of AdWords.”
Step One: Copy the Table to Clipboard
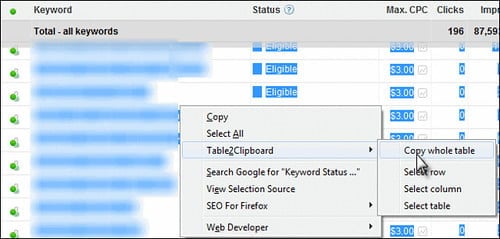
As a first step, you’ll want to download the FireFox plugin Table2Clipboard. Once it’s installed, you can actually grab the info from your screen without exporting via the AdWords interface, and get it into a manageable format pretty quickly. First highlight the rows of data in question:
Having copied the table, we then want to “clean” the data by pasting it into notepad. This clears out some of the formatting issues (you could also adjust the settings within Table2Clipboard to help with this).
Finally you can drop this back into Excel, delete the two blank columns on the left, and format your data as a table.
Now you can quickly segment your data and drill down to control versus experiment results with a simple filter:
And then we can either use the above filter to look at our data side by side, or create two segments and look at an aggregate view of how the controls are performing against the experiments.
Why is This an Important Tactic?
I find the tactic handy for getting this specific report out of AdWords and into Excel so that I can manipulate the data, but realistically AdWords will probably add better reporting functionality to the Campaign Experiments product sooner or later (maybe even before it’s out of Beta!) but it’s important to be aware of great free tools (though you can create some good Karma for yourself by donating to the project) like Table2Clipboard that can help you get higher resolution into your paid search campaigns.


0 Comments