Twitter caused quite the stir a few months back when it unveiled its long-awaited analytics platform. For hardcore tweeters, Twitter Analytics offers a tantalizing glimpse at data we’ve been dreaming about getting our hands on for eight long years.
If you’re anything like me, Twitter Analytics will soon become your latest obsession – I’ve spent hours poring over the wealth of data provided by Twitter Analytics, and it’s already changed the way I think about Twitter and how I leverage the power of Twitter in my social campaigns. In this post, I’ll give you a guided tour of Twitter Analytics and show you five actionable insights you can apply to your social and content strategies, so let’s dive right in!
1. Find Out How Many People Are REALLY Seeing Your Tweets
As you’d expect from an analytics tool, you can examine Impression data from within a specified date range by clicking on the date range button in the upper-right corner of the page. This setting defaults to the previous 28-day range, but has been set to December 12 – January 12 in this example:
Once you’ve set the date range, the Impression data timeline will adjust dynamically to display the data from the specified date range. You can also look at a month-by-month snapshot of your data by selecting the desired month from the list.
The Impressions data timeline is color-coded, with blue bars representing organic impressions and yellow representing paid impressions from ads, promoted tweets and the like.
Although this is a great start, Twitter Analytics restricts the maximum possible date range users can access to any given 91-day window. This could be frustrating to users who want to see large-scale changes in performance, particularly if they implemented major changes in their accounts. Still, for most users, the maximum 91-day period should be fine – but it’s something I hope Twitter will improve in the future.
2. Figure Out If Your Paid Promotions Are Worth the Money
As I was combing through my own data, I noticed that the effectiveness of my recent paid promotion experiments wasn’t as great as I thought it would be.
I’m not spending a lot on these experiments in paid promotions (around $200 per day or so), and I haven’t been running them for long, but as you can see from my Impressions data, my Promoted Tweets haven’t had a huge impact on the number of impressions. Sure, more people saw those tweets than probably would have if I hadn’t paid to promote them, but the impact isn’t all that great. I could have gotten the same result by tweeting the thing twice, for example. This tells me I either need to spend more on promotion, or rethink which tweets I pay to promote (or both).
Obviously this might not be the case in your account, but it’s interesting that Twitter’s own data may result in advertisers being more discerning about their advertising spend. Hopefully, it’ll also make Twitter more transparent about the service’s viability as an advertising platform. (Learn more about how we’ve used Twitter advertising to successfully generate leads.)
3. See How People Are Actually Engaging with Your Tweets
Twitter Analytics’ Engagements data is where things start to get tricky. Twitter considers all interactions with a tweet as engagement. This means that the single number presented in the tweet list format can be a little misleading, or at the very least, deserving of further investigation.
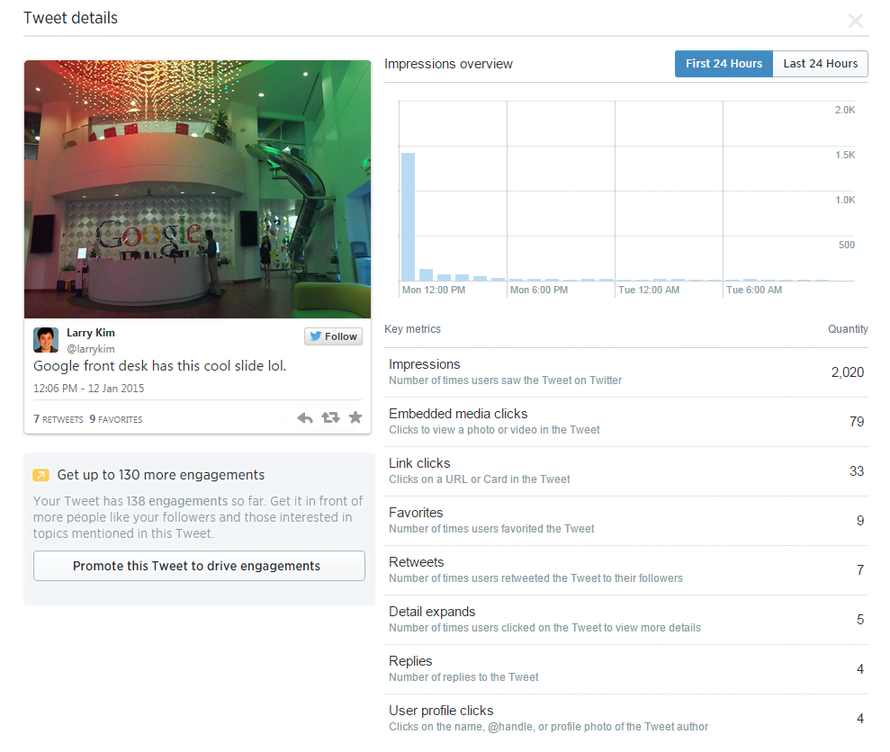
As you can see in the screenshot below, this tweet (of a photo I took during a recent visit to Google in Mountain View) received 141 engagements – but what does this mean?
To see the specific engagement metrics for an individual tweet, simply click on it. This will open a secondary window with the real data.
This is where you’ll see a detailed breakdown of your engagement metrics. As you can see, this tweet received 79 embedded media clicks, 33 link clicks, 9 Favorites, and 7 Retweets, among other interactions. This lets you quickly and easily see how your followers are interacting with your content. It’s great to see an at-a-glance number of the total “Engagements,” but this data is potentially much more useful!
Twitter Analytics doesn’t offer any engagement filtering options, meaning that – for now – we’re stuck with this aggregate total of all interactions as the benchmark for our engagement data. Hopefully this is a feature we’ll see in the future.
One thing that was immediately obvious to me was that tweets with images perform so much more strongly than those without. I’ve long suspected that this was the case, but I had no idea how much of a difference including images in your tweets can make.
Something else I noticed was that a lot of people will retweet without actually clicking on the link in a tweet. If you want to get a lot of retweets (and who doesn’t?), you have to create tweets that people are comfortable sharing without necessarily reading.
4. Experiment with Topic Engagement to Create Killer Content
Most content marketers limit themselves to using Twitter solely as a promotional tool. Don’t get me wrong – Twitter can be invaluable for promoting your best content, but it can also be used to gauge how well certain content will perform on social long before you sit down to write a full blog post.
Recently, I came across an interesting graphic and tweeted a link to it:
As you can see, Twitter Analytics helped me find the data about engagement for this particular tweet. Tweets with images always perform more strongly than those without them, but this one had an engagement rate of 8.0% – significantly higher than many of my other tweets.
With that in mind, I wrote up a piece focusing on the graphic for my column at Inc. magazine, which performed very well. It was shared over 6,400 times in just a few days, which is 10x higher than the average Inc. magazine article!
Since it only takes a minute or two to compose and send a tweet, doing so and checking your Twitter Analytics data is a great way to identify new topic areas that really resonate with your following.
5. Learn More About Who’s Really Following You – A LOT More
With Twitter promising advertisers access to detailed demographic data, it should come as no surprise that Twitter Analytics’ audience data is among the platform’s most valuable and useful sections. To access it, click on “Followers” in the top menu.
This is where you can learn a great deal about the people who are following you.
At the top of this report, you’ll see a chart that plots your follower count over time (which is hopefully trending up, as mine is). Unlike the date range data in the Impressions report, your followers graph goes back much further. In this instance, the data being displayed begins on August 6 2012 until January 12 2015:
I’ve only really started using Twitter frequently in the past year or so. I always suspected that being more active on Twitter and engaging with other users would help increase my following, but I had no idea how fast my follower count would ramp up – it took me about six years to attract my first 8,000 followers, but I’ve picked up the remaining 29,000 or so in the past year!
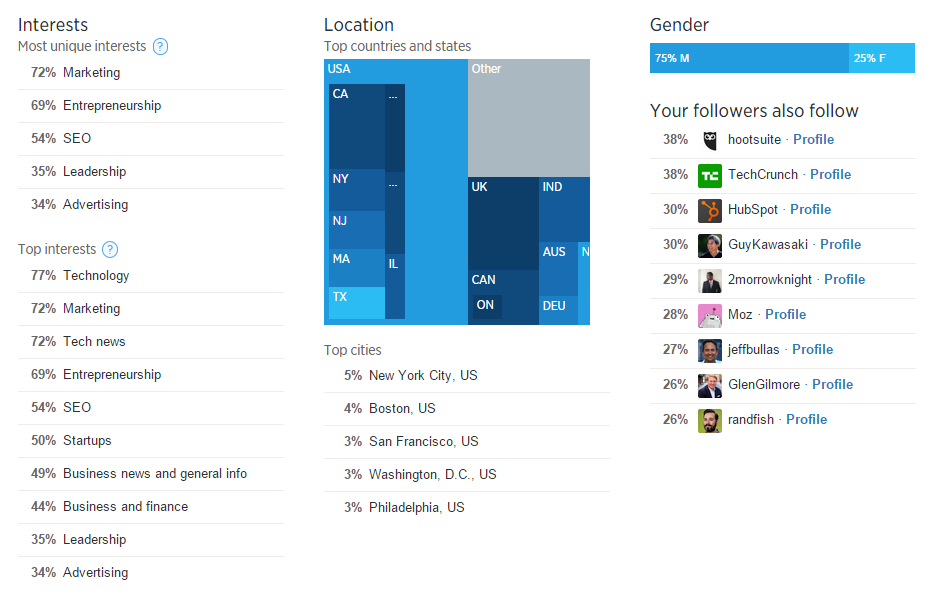
Beneath the follower timeline graph is where the real action is. This is where you’ll find all sorts of demographic data on your followers, including interests, location, and the other types of Twitter users your followers are following.
As you can see, most of my followers are interested in marketing, located in the United States, and a sizable majority are male. It’s not really shocking that three of my top five cities are the country’s top hotspots for entrepreneurship, but I was a little surprised to see Philadelphia rounding out my top five. I guess the startup scene in the City of Brotherly Love needs more attention!
Winning @Twitter with Data
There are a lot of articles out there telling you the best time to tweet and who to follow on Twitter and the perfect type of tweet to encourage engagement, but if Twitter Analytics shows us anything, it’s that you should rely on your data, not somebody else’s aggregated interpretation. What works for someone else might not work for you. Take a long, hard look at what tweets are resonating with your audience and build on that. Do more of what works, less of what doesn’t, and your Twitter profile will become more engaging.
How are you using Twitter Analytics? I’d love to hear your tips and tricks!


0 Comments