Google Ads already has dedicated columns you can use to review the performance of your video campaigns. While these built-in columns are always helpful, sometimes you just need more information. This is where YouTube Studio can be extremely helpful. YouTube Studio’s analytics can provide a ton of data on how organic and paid viewers interact with your YouTube videos.
There are so many reports in this tool we do not get within Google Ads. So whenever I am working on an account running Google Ads video campaigns, I require my clients to grant me access to their Channel Analytics so I can get more information to make better optimization decisions. In this post, I am going to cover just four of the reports I look at the most:
- Device type
- External sources
- Key moments
- Suggested videos
I’ll show you how to pull the reports as well as how you can use them to improve your video ad performance.
1. Use the “Device type” report to avoid misleading data
Right away you may be thinking, “We can already get device information in Google Ads. This is not anything new.” While that is true, YouTube Studio Channel Analytics can tell a bigger picture. Here is one view of the initial data we get on the Device type tab.
When looking at the default three columns displayed, the Computers and Mobile phone categories get the majority of the watch time. TV and Game consoles, however, are getting a much higher Average view duration. More watch time could mean better engagement, so you may feel inclined to push those devices more.
But this actually isn’t the right move. Click on the blue and white “plus” button to add “Card clicks,” and “Average percentage viewed.”
Now we can see a different story. While Average view duration is longer for TV and Game console, these devices have zero clicks. This is because TV and Game console devices will not show your cards. If you are running a TrueView discovery campaign, you’ll be paying for those video views even though they’re not converting. Unless you’re also striving for awareness or video engagement, the metrics in this view suggests that you only run your campaigns on Computer or Mobile phones.
2. Use the “External sources” report to create Custom Audiences
In the Traffic Sources report, you can drill down further to look at where your video traffic came from. The first one I like to check out is External sources. These referral sources are going to be placements outside of YouTube. Here is one example.
We see common sources like Facebook and LinkedIn. The blurred-out sources are actual domains, concealed for client confidentiality. If other websites or blogs are sharing your video content (easier when you allow people to embed your videos), we can see where the video was shared. If you have a large enough list of referral sources, you can use this list in a variety of ways.
- Take the list of External sources and see if you can use them as managed placement targeting options in your Display campaigns.
- Use the list of External sources in a Custom Audience for a variety of Display, Video, or Discovery campaigns.
- Admittingly not as common, but answer Quora questions using your channel’s videos embedded in the answers. You can then start building video user audiences from certain videos to use for future remarketing campaigns from a very reliable source.
3. Use the “Key moments” report to identify the best video for your campaign
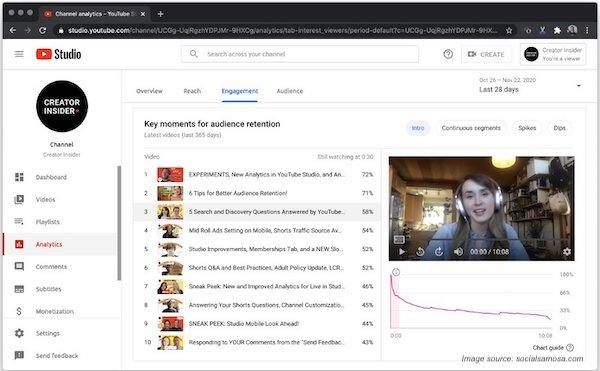
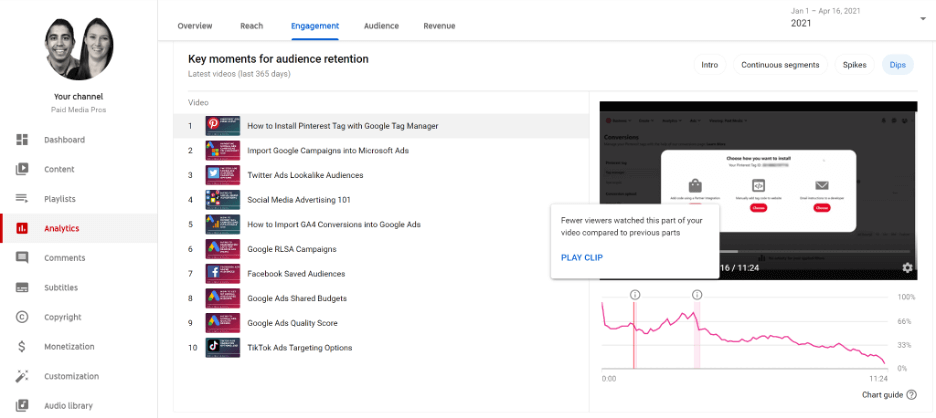
This area I use primarily for TrueView discovery campaigns which have become my favorite YouTube campaign format for many reasons. With a TrueView discovery campaign, you are sending users to the video watch page. In my opinion, if I am paying for that view every time, I want to make sure the user engages with the video as long as possible. With that in mind, I frequently rely on the Key Moments report to either research the best video or find out how to improve my video ads for TrueView discovery.
Key Moments will reveal particularly important segments in your video based on viewer behavior like:
- Continuous Segments where the majority of viewers don’t drop off
- Segments with spikes in audience retention
- Segments with dips in audience retention.
When you review these numbers by each video, you’ll get a good understanding of what moments in the video may need improvement. This can also help you plan how to structure future videos so you’re getting the most for your money if you decide to promote them with TrueView discovery.
4. Use the “Suggested videos” report for new placement ideas
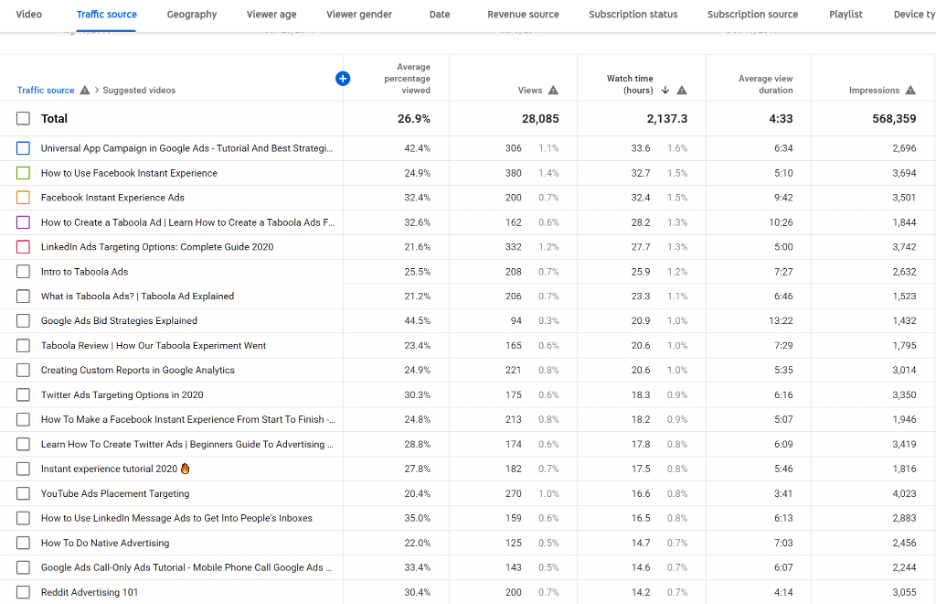
One of my favorite views in YouTube Studio’s Channel Analytics is the Suggested videos report. This report is also under Traffic Sources. Then click on the Suggested Videos source. Essentially what this report will show you is videos from other channels that are sending traffic to your own videos on your YouTube channel. Here is an example of what I mean using data from the channel I run with fellow WordStream writer, Michelle Morgan.
The video titles you see in the image above are not our videos. Our organic videos appeared as recommended options on the video titles we see in this report. So now we can ask the question, “How can this help our campaigns in Google Ads?”
Depending on which column is important to you, you can start gathering a list of new placement ideas to test for your video campaigns. If there are videos from other channels consistently sending traffic that have longer watch times or higher view duration averages, consider targeting those specific videos or the entire channel with ads.
Also remember you can show Display ads on YouTube videos as well. Even if you do not have the video creative to run YouTube campaigns, you can still try to place your Display Ads on any top-performing video placements or channels. Give the Suggested videos report a shot. You could find a great new source for building awareness to an audience already proven to be interested in your content.
Use these YouTube Studio reports to further improve your video ad campaigns
The columns we get in Google Ads are still valuable and still important, but YouTube Studio provides a deeper layer. It is pretty easy to go down the data rabbit hole in the Channel Analytics, but hopefully this post gave you some ideas to consider for your own account. Try and see the larger picture of what is actually working (or not working) from your video campaigns to make a more informed decision on how your video campaigns should be optimized.


0 Comments